🚀 Challenge #1: At the airport
You have been provided a database built on SQLite which contains information about airports. The schema is displayed below. You will use the SQLite extension in Visual Studio Code to display information about different cities’ airports.
Instructions
To get started with the assignment, you’ll need to perform a couple of steps. You’ll need to install a bit of tooling and download the sample database.
Setup your system
You can use Visual Studio Code and the SQLite extension to interact with the database.
- Navigate to code.visualstudio.com and follow the instructions to install Visual Studio Code
- Install the SQLite extension extension as instructed on the Marketplace page
Download and open the database
Next you will download an open the database.
- Download the database file from GitHub and save it to a directory
- Open Visual Studio Code
- Open the database in the SQLite extension by selecting Ctl-Shift-P (or Cmd-Shift-P on a Mac) and typing
SQLite: Open database - Select Choose database from file and open the airports.db file you downloaded previously
- After opening the database (you won’t see an update on the screen), create a new query window by selecting Ctl-Shift-P (or Cmd-Shift-P on a Mac) and typing
SQLite: New query
Once open, the new query window can be used to run SQL statements against the database. You can use the command Ctl-Shift-Q (or Cmd-Shift-Q on a Mac) to run queries against the database.
For more information about the SQLite extension, you can consult the sqlite documentation.
Database schema
A database’s schema is its table design and structure. The airports database as two tables, cities, which contains a list of cities in the United Kingdom and Ireland, and airports, which contains the list of all airports. Because some cities may have multiple airports, two tables were created to store the information. In this exercise you will use joins to display information for different cities.
| Cities |
|---|
| id (PK, integer) |
| city (text) |
| country (text) |
| Airports |
|---|
| id (PK, integer) |
| name (text) |
| code (text) |
| city_id (FK to id in Cities) |
Assignment
Create queries to return the following information:
- all city names in the
Citiestable - all cities in Ireland in the
Citiestable - all airport names with their city and country
- all airports in London, United Kingdom
🚀 Challenge #2: Coca Cola
Instructions
The Kaggle Account of user Yiyi Wang hosts a Coca Cola data set, stored in a large Excel table. This Coca Cola Co spreadsheet is missing some calculations. Visit the account and, if necessary, inform yourself on the relevance of Kaggle - a site every data scientist should know.
Study the data set description on Kaggle. After that, your task is to:
- Calculate the Gross profits of FY ‘15, ‘16, ‘17, and ‘18
- Gross Profit = Net Operating revenues - Cost of goods sold
- Calculate the average of all the gross profits. Try to do this with a function.
- Average = Sum of gross profits divided by the number of fiscal years (10)
- Documentation on the AVERAGE function
- This is an Excel file, but it should be editable in any spreadsheet platform
🚀 Challenge #3: Principal Component Analysis
Principal Component Analysis is a very well established method to visualize high-dimensional data sets.
First, study the scikit learn demo for PCA on a very famous data set.
Afterwards, apply PCA either on image data using the MNIST Digits data set, medical data in the Breast Cancer Wisconsin Dataset, culinary data in the UCI Wine Dataset, or a data set of your own choice.
Hint: The following code lines may be useful to retrieve the data:
from sklearn.decomposition import PCA
from sklearn.datasets import load_wine, load_breast_cancer, load_digits

# Load datasets
wine = load_wine()
breast_cancer = load_breast_cancer()
digits = load_digits()
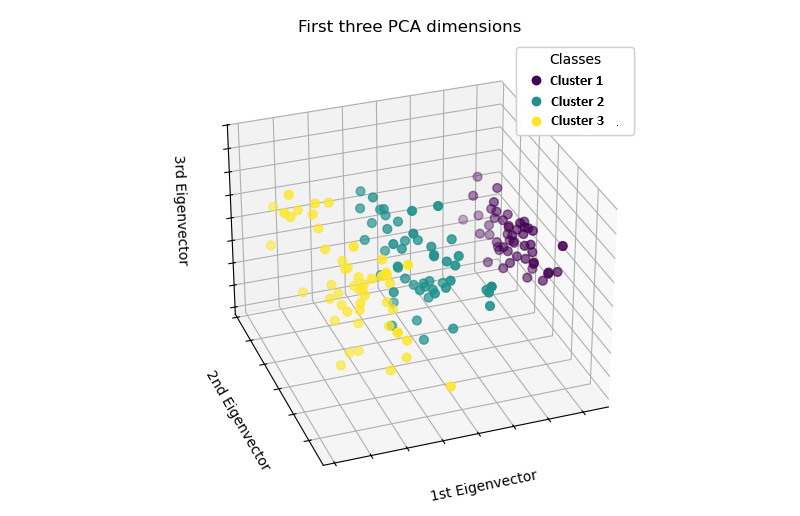
🚀 Challenge #4: PCA and clustering
Apply the k-means algorithm with a suitable k on your projected data. Create a plot of the reduced data, with different colors indication the cluster identifier of each sample, i.e., your plot should look something like this: